Chapter 1: Research and Development | 2024 AI Index Report
Chapter 1: Research and Development
1.1 Publications
Overview
The figures below present the global count of English- and Chinese-language AI publications from 2010 to 2022, categorized by type of affiliation and cross-sector collaborations. Additionally, this section details publication data for AI journal articles and conference papers.
Total Number of AI Publications
Figure 1.1.1 displays the global count of AI publications. Between 2010 and 2022, the total number of AI publications nearly tripled, rising from approximately 88,000 in 2010 to more than 240,000 in 2022. The increase over the last year was a modest 1.1%.
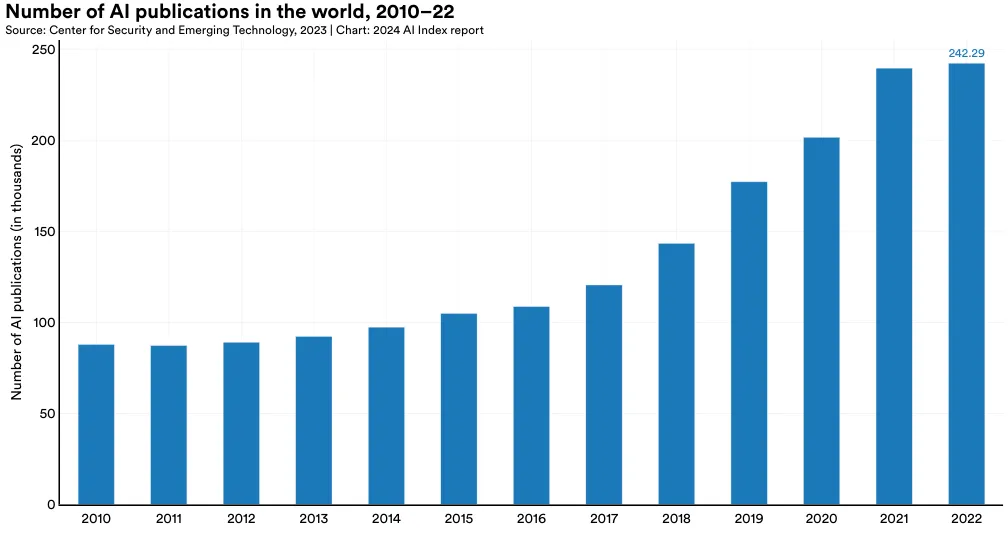
The data on publications presented this year is sourced from CSET. Both the methodology and data sources used by CSET to classify AI publications have changed since their data was last featured in the AI Index (2023). As a result, the numbers reported in this year’s section differ slightly from those reported in last year’s edition. Moreover, the AI-related publication data is fully available only up to 2022 due to a significant lag in updating publication data. Readers are advised to approach publication figures with appropriate caution.
By Type of Publication
Figure 1.1.2 illustrates the distribution of AI publication types globally over time. In 2022, there were roughly 230,000 AI journal articles compared to roughly 42,000 conference submissions. Since 2015, AI journal and conference publications have increased at comparable rates. In 2022, there were 2.6 times as many conference publications and 2.4 times as many journal publications as there were in 2015.
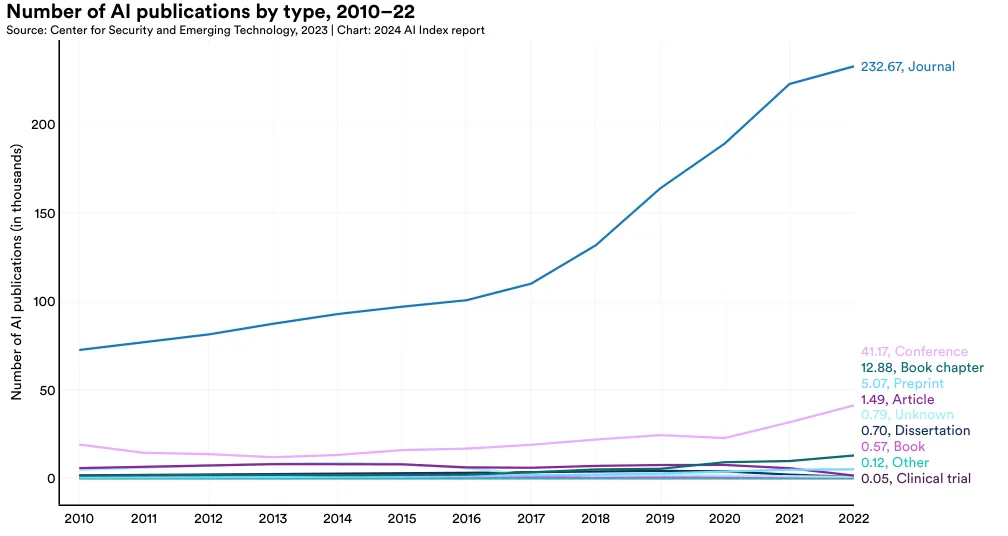
It is possible for an AI publication to be mapped to more than one publication type, so the totals in Figure 1.1.2 do not completely align with those in Figure 1.1.1.
By Field of Study
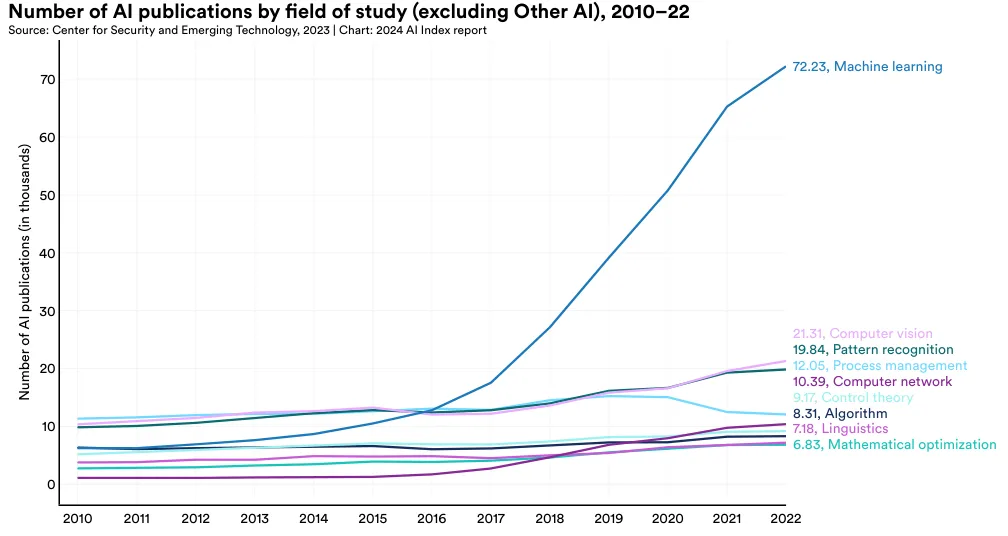
Figure 1.1.3 examines the total number of AI publications by field of study since 2010. Machine learning publications have seen the most rapid growth over the past decade, increasing nearly sevenfold since 2015. Following machine learning, the most published AI fields in 2022 were computer vision (21,309 publications), pattern recognition (19,841), and process management (12,052).
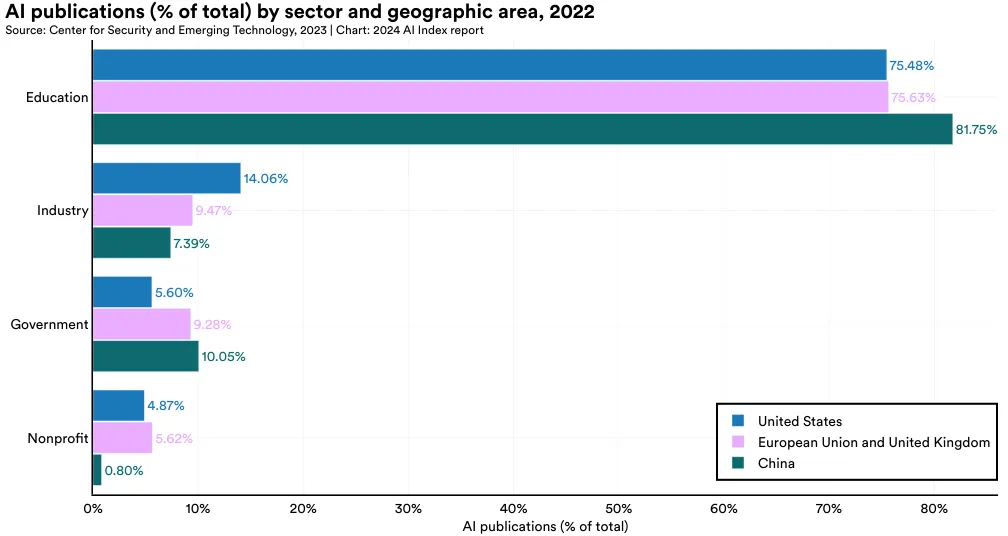
By Sector
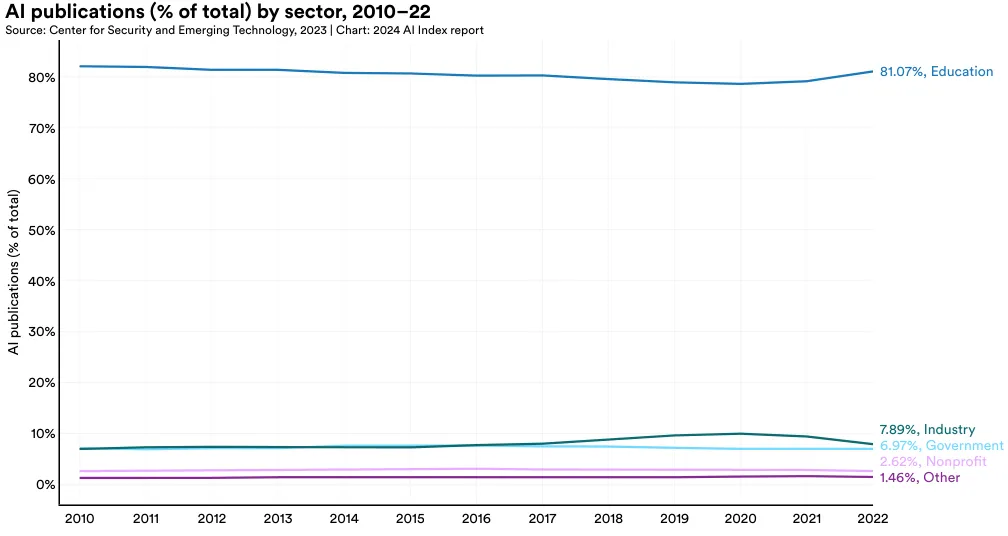
This section presents the distribution of AI publications by sector—education, government, industry, nonprofit, and other—globally and then specifically within the United States, China, and the European Union plus the United Kingdom. In 2022, the academic sector contributed the majority of AI publications (81.1%), maintaining its position as the leading global source of AI research over the past decade across all regions (Figure 1.1.4 and Figure 1.1.5). Industry participation is most significant in the United States, followed by the European Union plus the United Kingdom, and China (Figure 1.1.5).
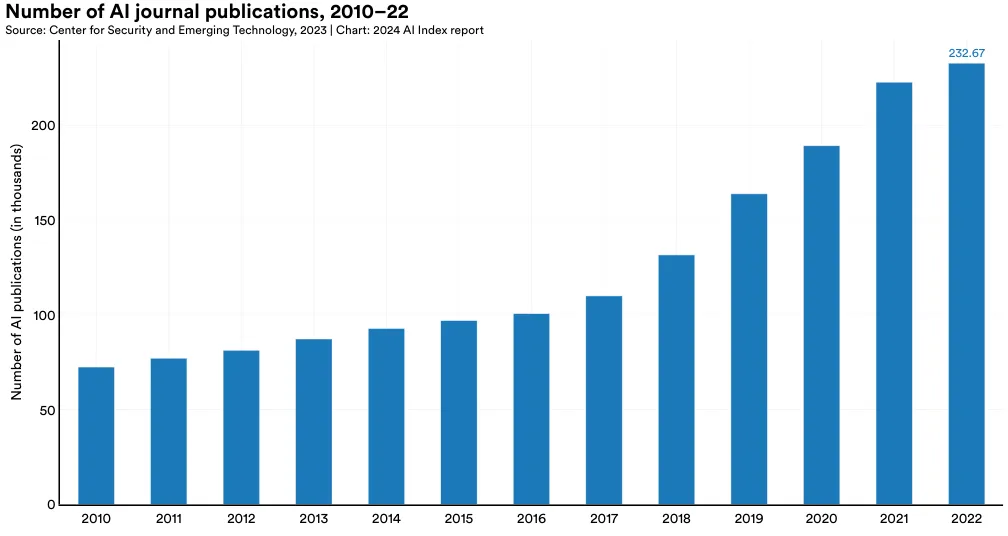
AI Journal Publications
Figure 1.1.6 illustrates the total number of AI journal publications from 2010 to 2022. The number of AI journal publications experienced modest growth from 2010 to 2015 but grew approximately 2.4 times since 2015. Between 2021 and 2022, AI journal publications saw a 4.5% increase.
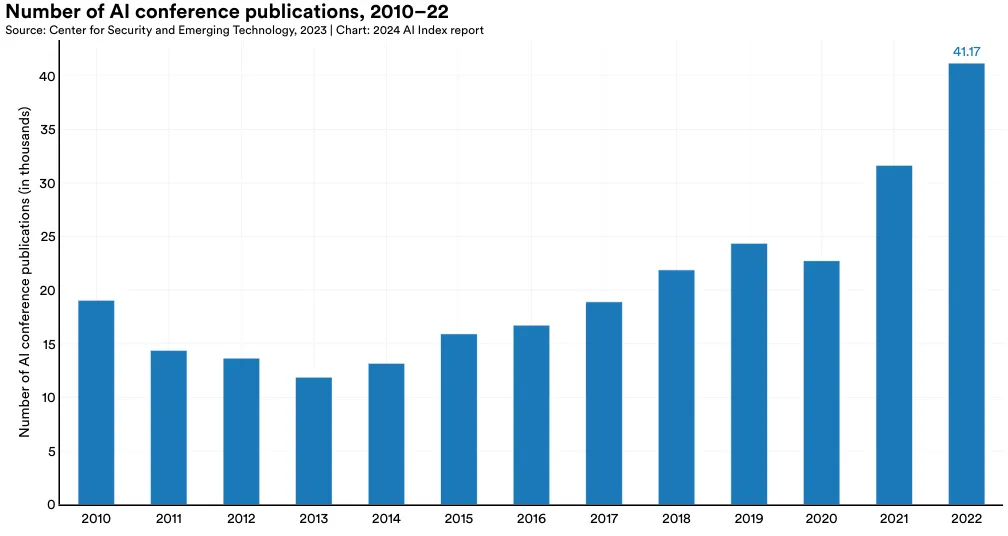
AI Conference Publications
Figure 1.1.7 visualizes the total number of AI conference publications since 2010. The number of AI conference publications has seen a notable rise in the past two years, climbing from 22,727 in 2020 to 31,629 in 2021, and reaching 41,174 in 2022. Over the last year alone, there was a 30.2% increase in AI conference publications. Since 2010, the number of AI conference publications has more than doubled.
1.2 Patents
AI Patents
Overview
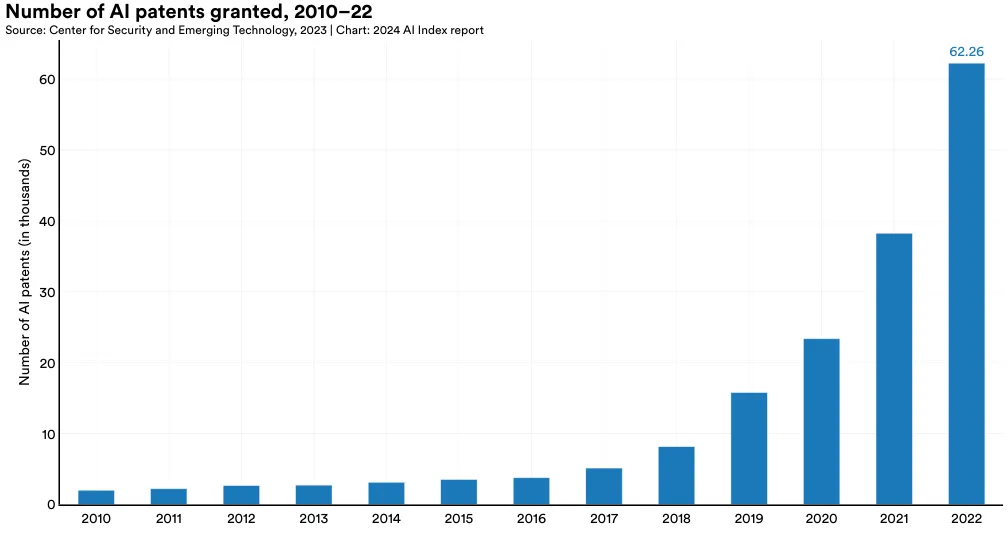
Figure 1.2.1 examines the global growth in granted AI patents from 2010 to 2022. Over the last decade, there has been a significant rise in the number of AI patents, with a particularly sharp increase in recent
By Filing Status and Region
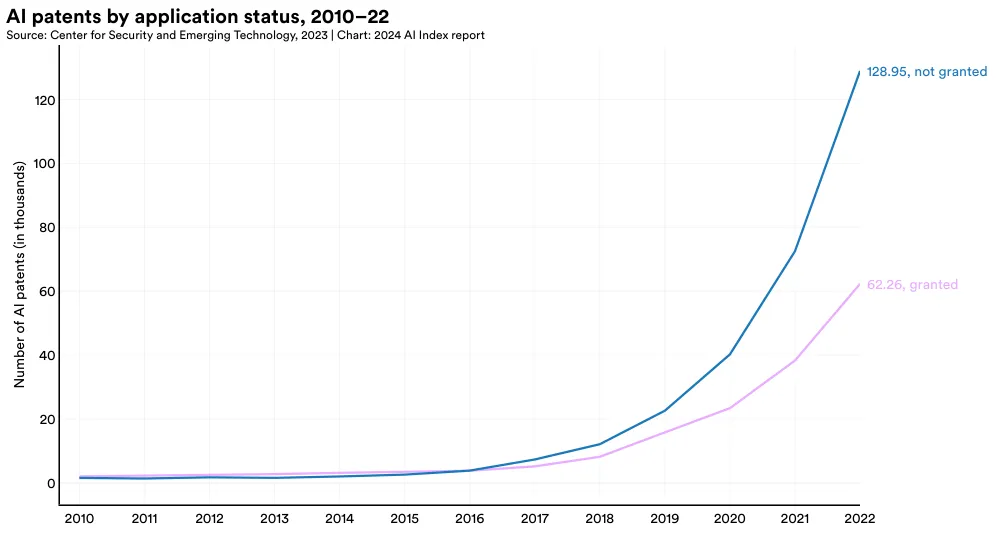
The following section disaggregates AI patents by their filing status (whether they were granted or not granted), as well as the region of their publication. Figure 1.2.2 compares global AI patents by application status. In 2022, the number of ungranted AI patents (128,952) was more than double the amount granted (62,264). Over time, the landscape of AI patent approvals has shifted markedly. Until 2015, a larger proportion of filed AI patents were granted. However, since then, the majority of AI patent filings have not been granted, with the gap widening significantly. For instance, in 2015, 42.2% of all filed AI patents were not granted. By 2022, this figure had risen to 67.4%.
The gap between granted and not granted AI patents is evident across all major patent-originating geographic areas, including China, the European Union and United Kingdom, and the United States (Figure 1.2.3). In recent years, all three geographic areas have experienced an increase in both the total number of AI patent filings and the number of patents granted.
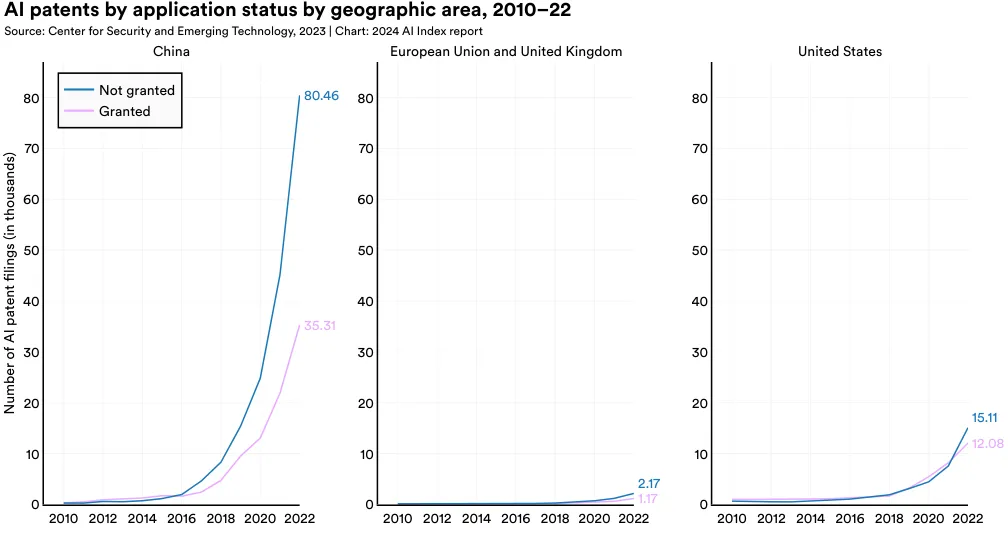
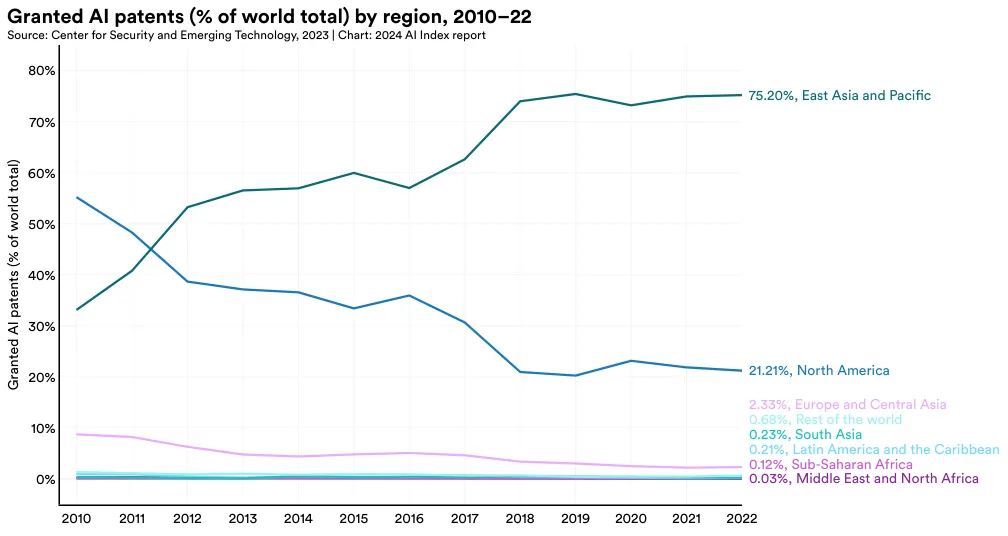
Figure 1.2.4 showcases the regional breakdown of granted AI patents. As of 2022, the bulk of the world’s granted AI patents (75.2%) originated from East Asia and the Pacific, with North America being the next largest contributor at 21.2%. Up until 2011, North America led in the number of global AI patents. However, since then, there has been a significant shift toward an increasing proportion of AI patents originating from East Asia and the Pacific.
Disaggregated by geographic area, the majority of the world’s granted AI patents are from China (61.1%) and the United States (20.9%) (Figure 1.2.5). The share of AI patents originating from the United States has declined from 54.1% in 2010.
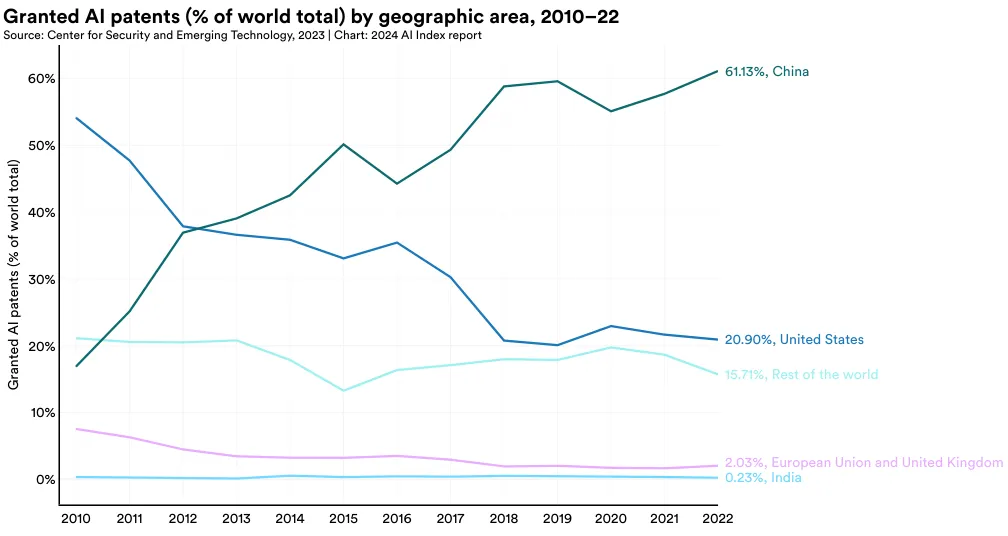
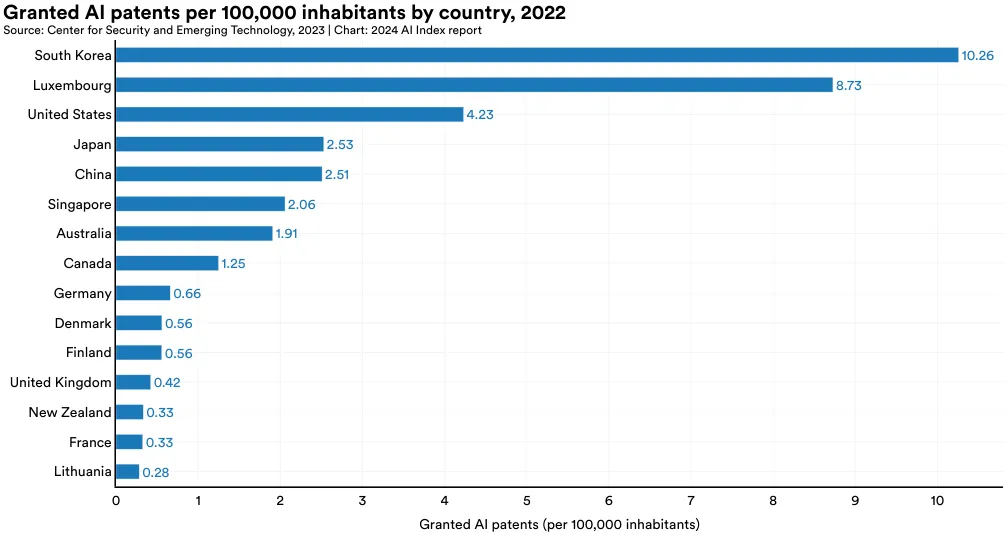
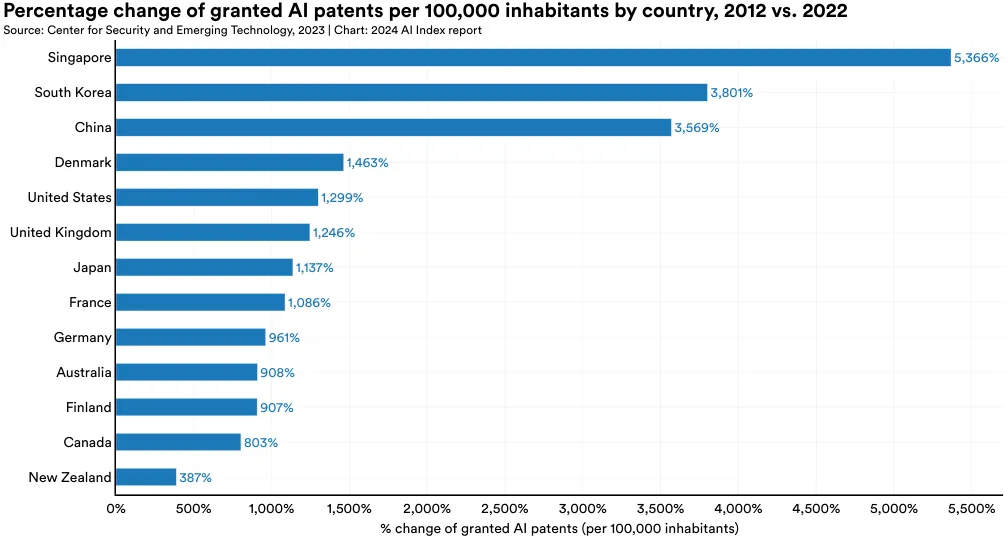
Figure 1.2.6 and Figure 1.2.7 document which countries lead in AI patents per capita. In 2022, the country with the most granted AI patents per 100,000 inhabitants was South Korea (10.3), followed by Luxembourg (8.8) and the United States (4.2) (Figure 1.2.6). Figure 1.2.7 highlights the change in granted AI patents per capita from 2012 to 2022. Singapore, South Korea, and China experienced the greatest increase in AI patenting per capita during that time period.
This section explores the frontier of AI research. While many new AI models are introduced annually, only a small sample represents the most advanced research. Admittedly what constitutes advanced or frontier research is somewhat subjective. Frontier research could reflect a model posting a new state-of-the-art result on a benchmark, introducing a meaningful new architecture, or exercising some impressive new capabilities.
The AI Index studies trends in two types of frontier AI models: “notable models” and foundation models.3 Epoch, an AI Index data provider, uses the term “notable machine learning models” to designate noteworthy models handpicked as being particularly influential within the AI/machine learning ecosystem. In contrast, foundation models are exceptionally large AI models trained on massive datasets, capable of performing a multitude of downstream tasks. Examples of foundation models include GPT-4, Claude 3, and Gemini. While many foundation models may qualify as notable models, not all notable models are foundation models.
Within this section, the AI Index explores trends in notable models and foundation models from various perspectives, including originating organization, country of origin, parameter count, and compute usage. The analysis concludes with an examination of machine learning training costs.
1.3 Frontier AI Research
General Machine Learning Models
Overview
Epoch AI is a group of researchers dedicated to studying and predicting the evolution of advanced AI. They maintain a database of AI and machine learning models released since the 1950s, selecting 1.3 Frontier AI Research entries based on criteria such as state-of-theart advancements, historical significance, or high citation rates. Analyzing these models provides a comprehensive overview of the machine learning landscape’s evolution, both in recent years and over the past few decades.4 Some models may be missing from the dataset; however, the dataset can reveal trends in relative terms.
3 “AI system” refers to a computer program or product based on AI, such as ChatGPT. “AI model” refers to a collection of parameters whose values are learned during training, such as GPT-4. 4 New and historic models are continually added to the Epoch database, so the total year-by-year counts of models included in this year’s AI Index might not exactly match those published in last year’s report.
Sector Analysis
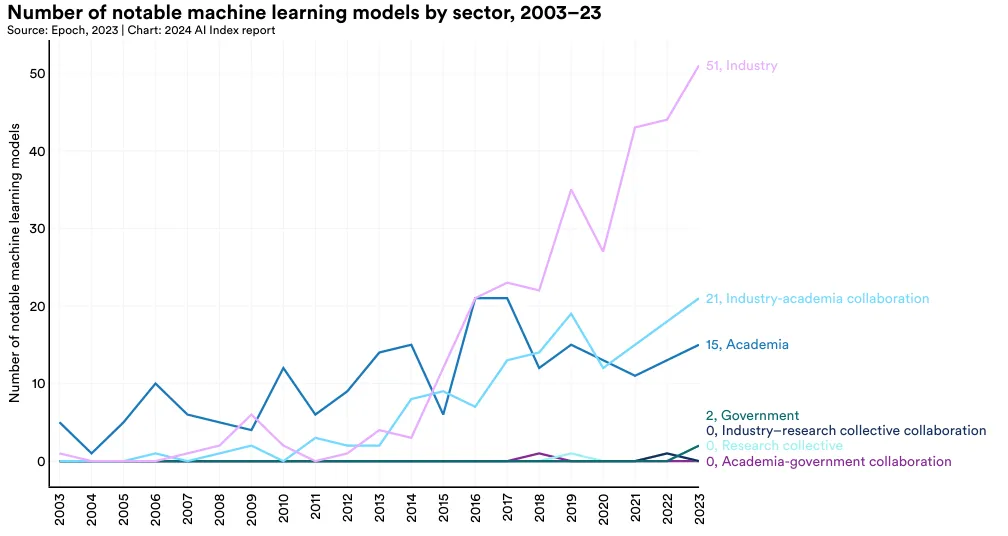
Until 2014, academia led in the release of machine learning models. Since then, industry has taken the lead. In 2023, there were 51 notable machine learning models produced by industry compared to just 15 from academia (Figure 1.3.1). Significantly, 21 notable models resulted from industry/academic collaborations in 2023, a new high. Creating cutting-edge AI models now demands a substantial amount of data, computing power, and financial resources that are not available in academia. This shift toward increased industrial dominance in leading AI models was first highlighted in last year’s AI Index report. Although this year the gap has slightly narrowed, the trend largely persists.
National Affiliation
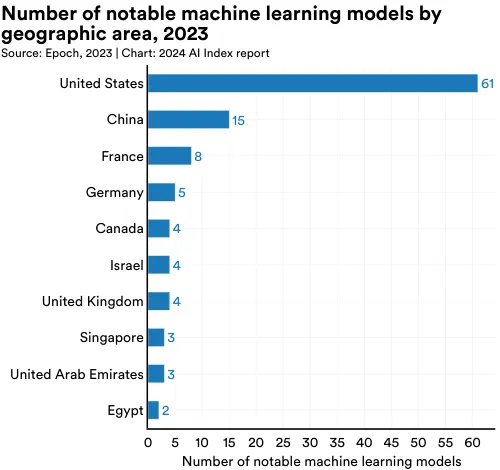
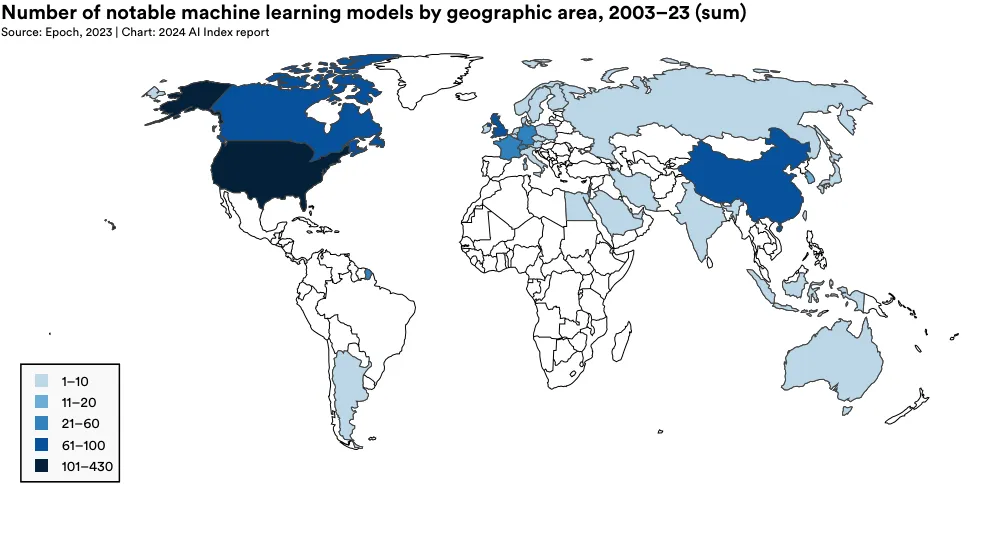
To illustrate the evolving geopolitical landscape of AI, the AI Index research team analyzed the country of origin of notable models. Figure 1.3.2 displays the total number of notable machine learning models attributed to the location of researchers’ affiliated institutions.5 In 2023, the United States led with 61 notable machine learning models, followed by China with 15, and France with 8. For the first time since 2019, the European Union and the United Kingdom together have surpassed China in the number of notable AI models produced (Figure 1.3.3). Since 2003, the United States has produced more models than other major geographic regions such as the United Kingdom, China, and Canada (Figure 1.3.4).
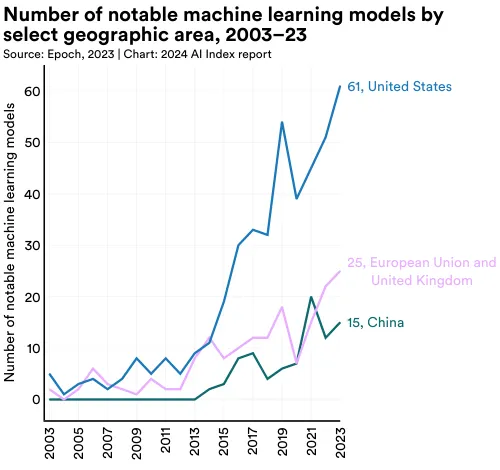
5 A machine learning model is considered associated with a specific country if at least one author of the paper introducing it has an affiliation with an institution based in that country. In cases where a model’s authors come from several countries, double counting can occur.
Parameter Trends
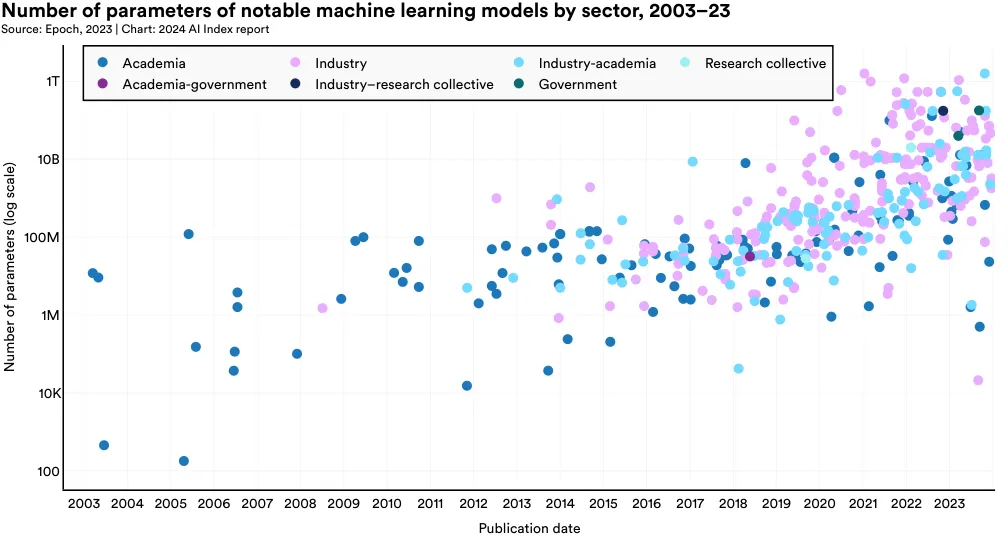
Parameters in machine learning models are numerical values learned during training that determine how a model interprets input data and makes predictions. Models trained on more data will usually have more parameters than those trained on less data. Likewise, models with more parameters typically outperform those with fewer parameters.
Figure 1.3.5 demonstrates the parameter count of machine learning models in the Epoch dataset, categorized by the sector from which the models originate. Parameter counts have risen sharply since the early 2010s, reflecting the growing complexity of tasks AI models are designed for, the greater availability of data, improvements in hardware, and proven efficacy of larger models. High-parameter models are particularly notable in the industry sector, underscoring the capacity of companies like OpenAI, Anthropic, and Google to bear the computational costs of training on vast volumes of data.
Compute Trends
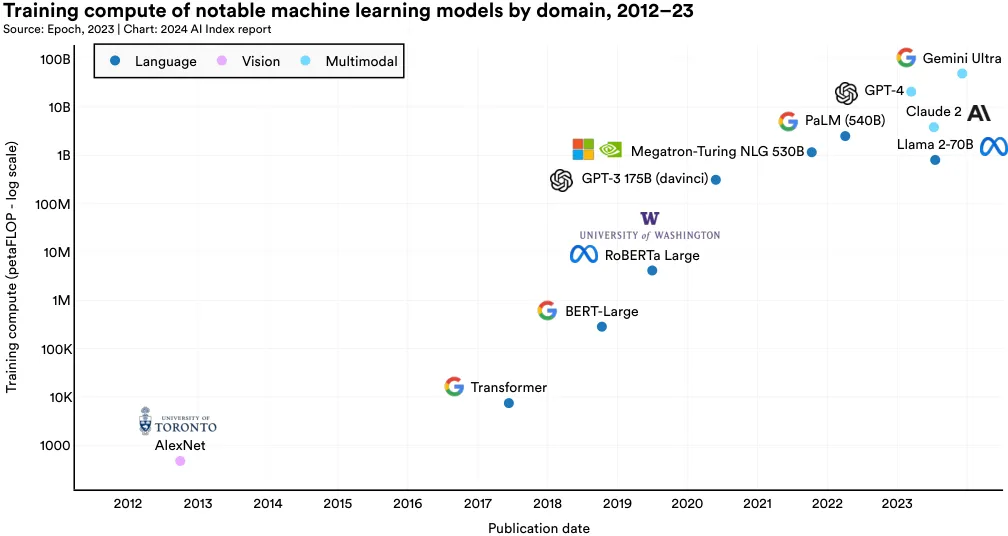
The term “compute” in AI models denotes the computational resources required to train and operate a machine learning model. Generally, the complexity of the model and the size of the training dataset directly influence the amount of compute needed. The more complex a model is, and the larger the underlying training data, the greater the amount of compute required for training. Figure 1.3.6 visualizes the training compute required for notable machine learning models in the last 20 years. Recently, the compute usage of notable AI models has increased exponentially.6 This trend has been especially pronounced in the last five years. This rapid rise in compute demand has critical implications. For instance, models requiring more computation often have larger environmental footprints, and companies typically have more access to computational resources than academic institutions.
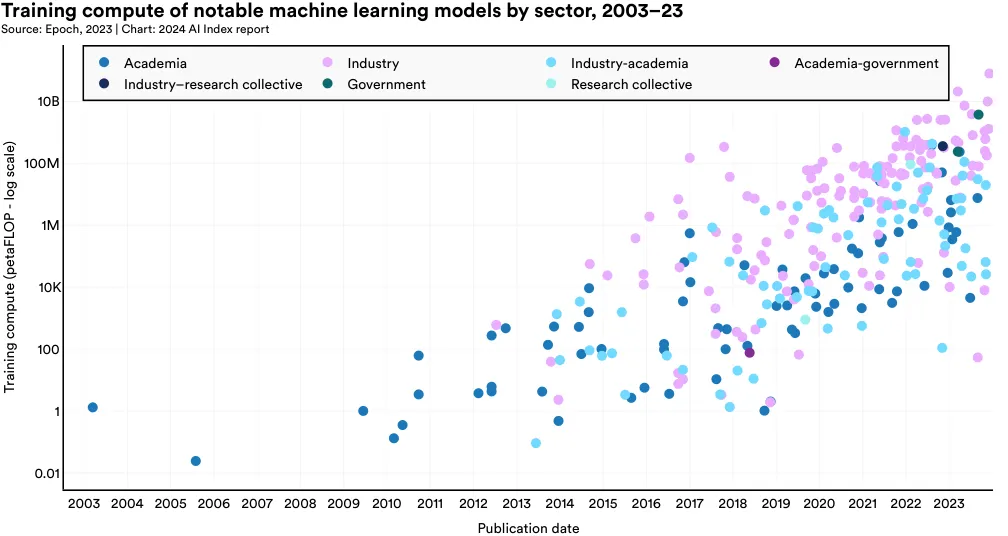
Figure 1.3.7 highlights the training compute of notable machine learning models since 2012. For example, AlexNet, one of the papers that popularized the now standard practice of using GPUs to improve AI models, required an estimated 470 petaFLOPs for training. The original Transformer, released in 2017, required around 7,400 petaFLOPs. Google’s Gemini Ultra, one of the current state-of-the-art foundation models, required 50 billion petaFLOPs.
Highlight: Will Models Run Out Of Data?
As illustrated above, a significant proportion of recent algorithmic progress, including progress behind powerful LLMs, has been achieved by training models on increasingly larger amounts of data. As noted recently by Anthropic cofounder and AI Index Steering Committee member Jack Clark, foundation models have been trained on meaningful percentages of all the data that has ever existed on the internet.
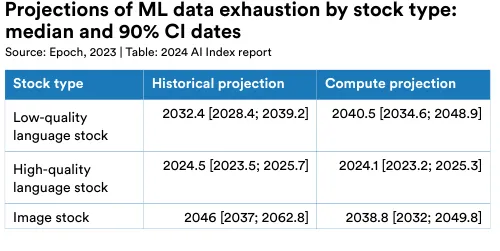
The growing data dependency of AI models has led to concerns that future generations of computer scientists will run out of data to further scale and improve their systems. Research from Epoch suggests that these concerns are somewhat warranted. Epoch researchers have generated historical and compute-based projections for when AI researchers might expect to run out of data. The historical projections are based on observed growth rates in the sizes of data used to train foundation models. The compute projections adjust the historical growth rate based on projections of compute availability.
For instance, the researchers estimate that computer scientists could deplete the stock of high-quality language data by 2024, exhaust lowquality language data within two decades, and use up image data by the late 2030s to mid-2040s (Figure 1.3.8). Theoretically, the challenge of limited data availability can be addressed by using synthetic data, which is data generated by AI models themselves. For example, it is possible to use text produced by one LLM to train another LLM. The use of synthetic data for training AI systems is particularly attractive, not only as a solution for potential data depletion but also because generative AI systems could, in principle, generate data in instances where naturally occurring data is sparse—for example, data for rare diseases or underrepresented populations. Until recently, the feasibility and effectiveness of using synthetic data for training generative AI systems were not well understood. However, research this year has suggested that there are limitations associated with training models on synthetic data.
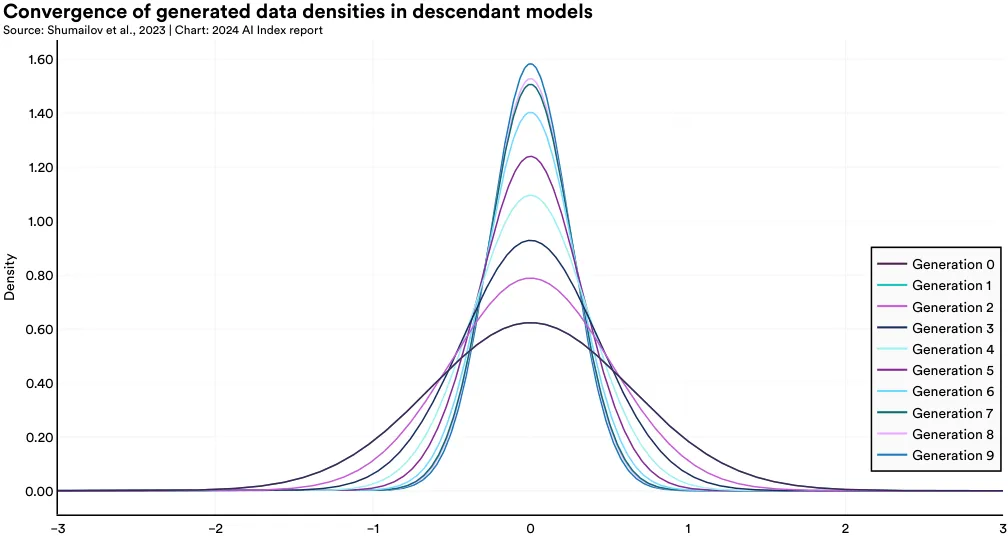
For instance, a team of British and Canadian researchers discovered that models predominantly trained on synthetic data experience model collapse, a phenomenon where, over time, they lose the ability to remember true underlying data distributions and start producing a narrow range of outputs. Figure 1.3.9 demonstrates the process of model collapse in a variational autoencoder (VAE) model, a widely used generative AI architecture. With each subsequent generation trained on additional synthetic data, the model produces an increasingly limited set of outputs. As illustrated in Figure 1.3.10, in statistical terms, as the number of synthetic generations increases, the tails of the distributions vanish, and the generation density shifts toward the mean.7 This pattern means that over time, the generations of models trained predominantly on synthetic data become less varied and are not as widely distributed. The authors demonstrate that this phenomenon occurs across various model types, including Gaussian Mixture Models and LLMs. This research underscores the continued importance of humangenerated data for training capable LLMs that can produce a diverse array of content.

7 In the context of generative models, density refers to the level of complexity and variation in the outputs produced by an AI model. Models that have a higher generation density produce a wider range of higher-quality outputs. Models with low generation density produce a narrower range of more simplistic outputs.
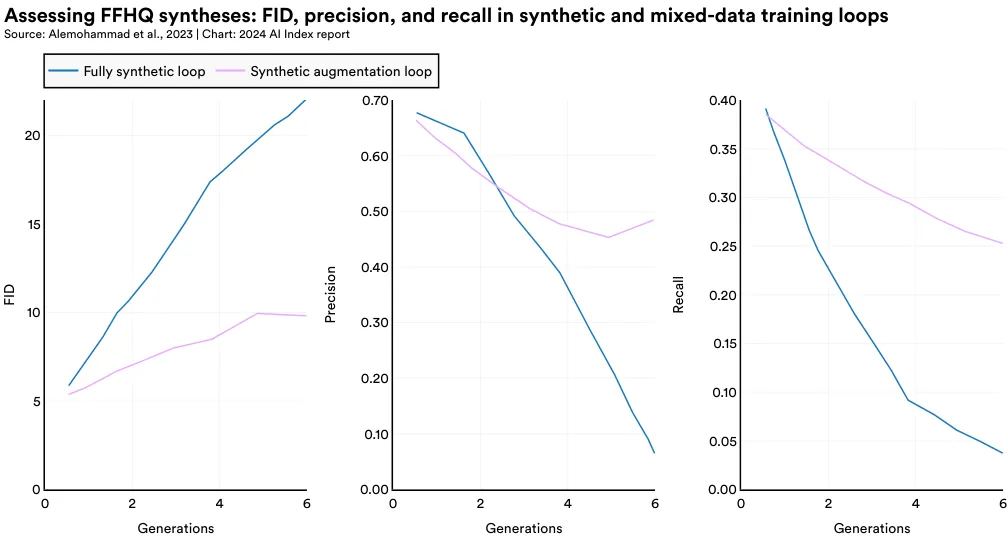
In a similar study published in 2023 on the use of synthetic data in generative imaging models, researchers found that generative image models trained solely on synthetic data cycles—or with insufficient real human data—experience a significant drop in output quality. The authors label this phenomenon Model Autophagy Disorder (MAD), in reference to mad cow disease.
The study examines two types of training processes: fully synthetic, where models are trained exclusively on synthetic data, and synthetic augmentation, where models are trained on a mix of synthetic and real data. In both scenarios, as the number of training generations increases, the quality of the generated images declines. Figure 1.3.11 highlights the degraded image generations of models that are augmented with synthetic data; for example, the faces generated in steps 7 and 9 increasingly display strange-looking hash marks. From a statistical perspective, images generated with both synthetic data and synthetic augmentation loops have higher FID scores (indicating less similarity to real images), lower precision scores (signifying reduced realism or quality), and lower recall scores (suggesting decreased diversity) (Figure 1.3.12). While synthetic augmentation loops, which incorporate some real data, show less degradation than fully synthetic loops, both methods exhibit diminishing returns with further training.

Foundation Models
Foundation models represent a rapidly evolving and popular category of AI models. Trained on vast datasets, they are versatile and suitable for numerous downstream applications. Foundation models such as GPT-4, Claude 3, and Llama 2 showcase remarkable abilities and are increasingly being deployed in realworld scenarios. Introduced in 2023, the Ecosystem Graphs is a new community resource from Stanford that tracks the foundation model ecosystem, including datasets, models, and applications. This section uses data from the Ecosystem Graphs to study trends in foundation models over time.8
Model Release
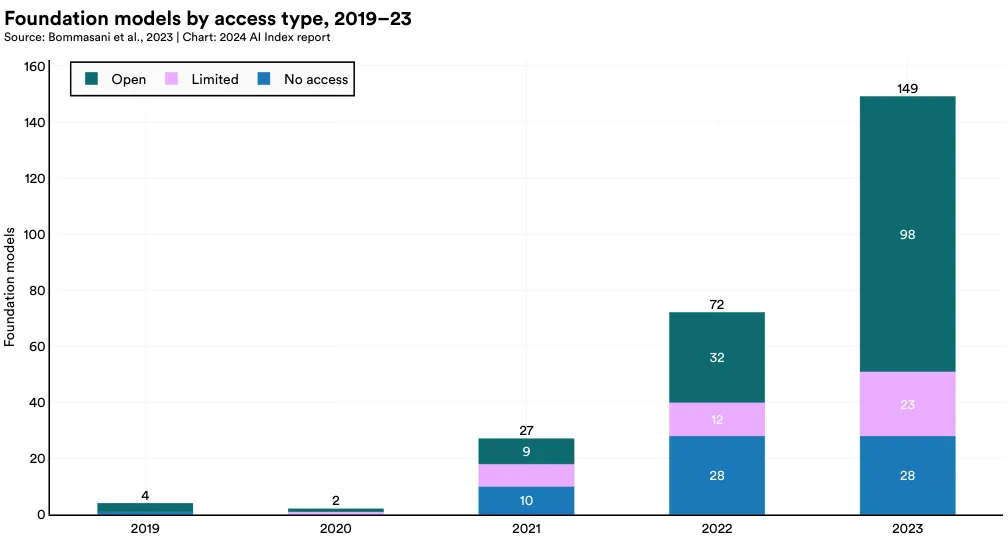
Foundation models can be accessed in different ways. No access models, like Google's PaLM-E, are only accessible to their developers. Limited access models, like OpenAI's GPT-4, offer limited access to the models, often through a public API. Open models, like Meta's Llama 2, fully release model weights, which means the models can be modified and freely used.
Figure 1.3.13 visualizes the total number of foundation models by access type since 2019. In recent years, the number of foundation models has risen sharply, more than doubling since 2022 and growing by a factor of nearly 38 since 2019. Of the 149 foundation models released in 2023, 98 were open, 23 limited and 28 no access.
8 The Ecosystem Graphs make efforts to survey the global AI ecosystem, but it is possible that they underreport models from certain nations like South Korea and China.
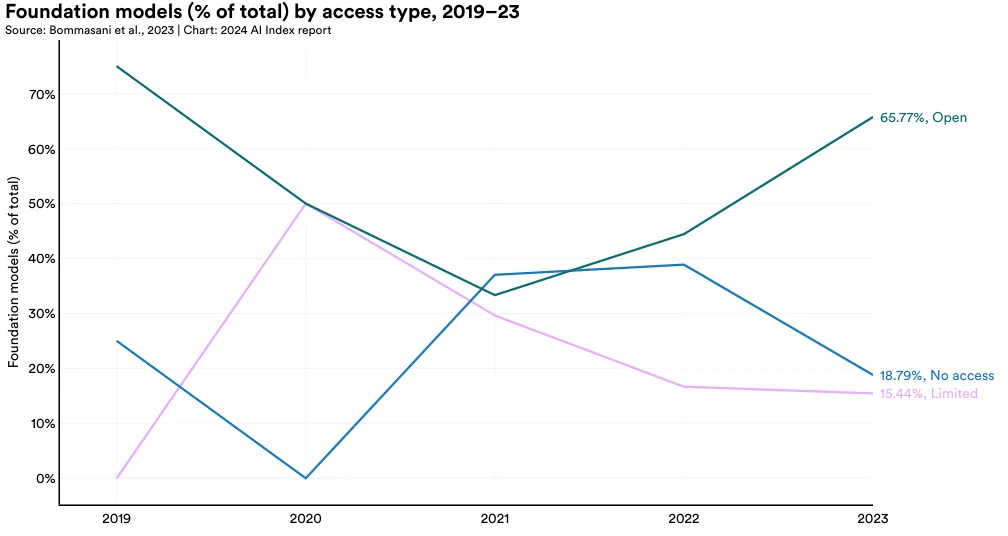
In 2023, the majority of foundation models were released as open access (65.8%), with 18.8% having no access and 15.4% limited access (Figure 1.3.14). Since 2021, there has been a significant increase in the proportion of models released with open access.
Organizational Affiliation
Figure 1.3.15 plots the sector from which foundation models have originated since 2019. In 2023, the majority of foundation models (72.5%) originated from industry. Only 18.8% of foundation models in 2023 originated from academia. Since 2019, an ever larger number of foundation models are coming from industry.
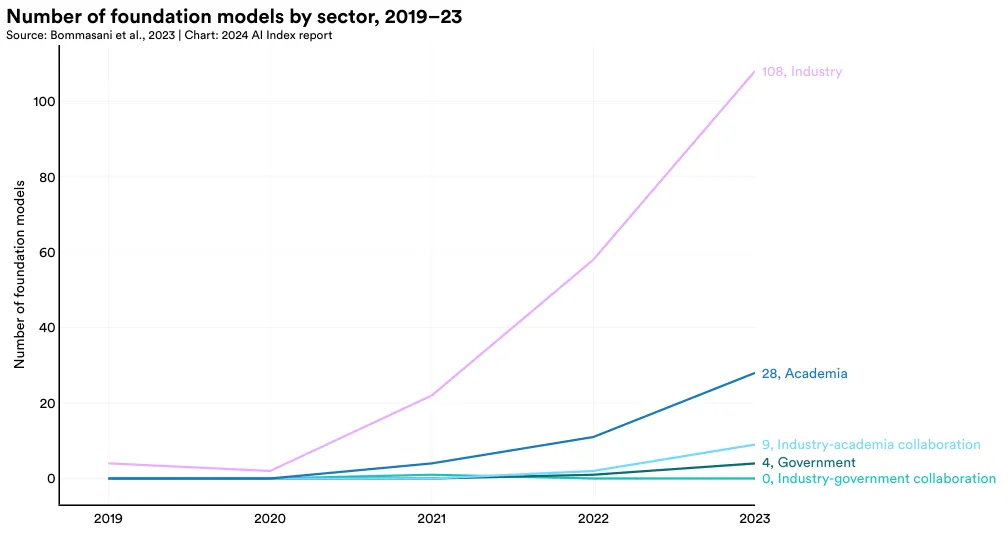
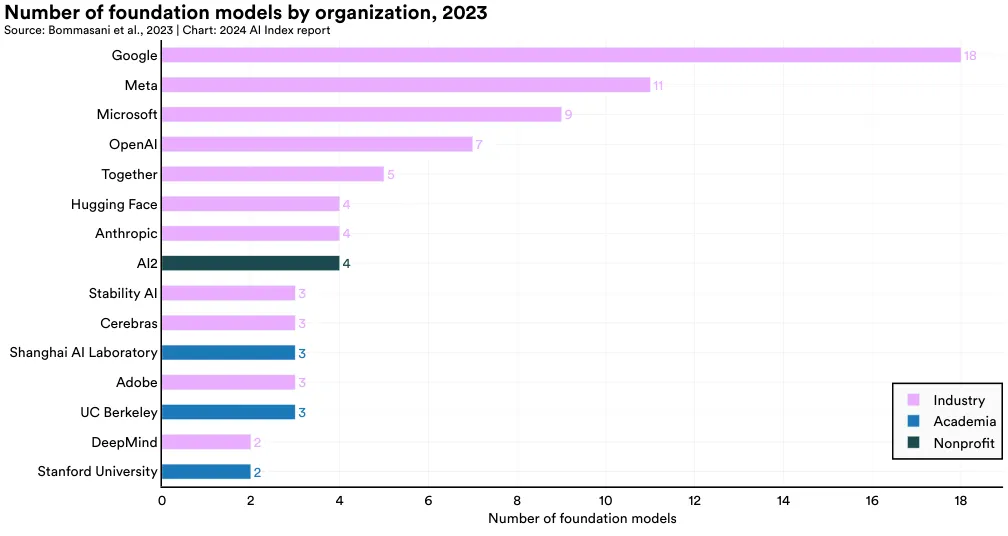
Figure 1.3.16 highlights the source of various foundation models that were released in 2023. Google introduced the most models (18), followed by Meta (11), and Microsoft (9). The academic institution that released the most foundation models in 2023 was UC Berkeley (3).
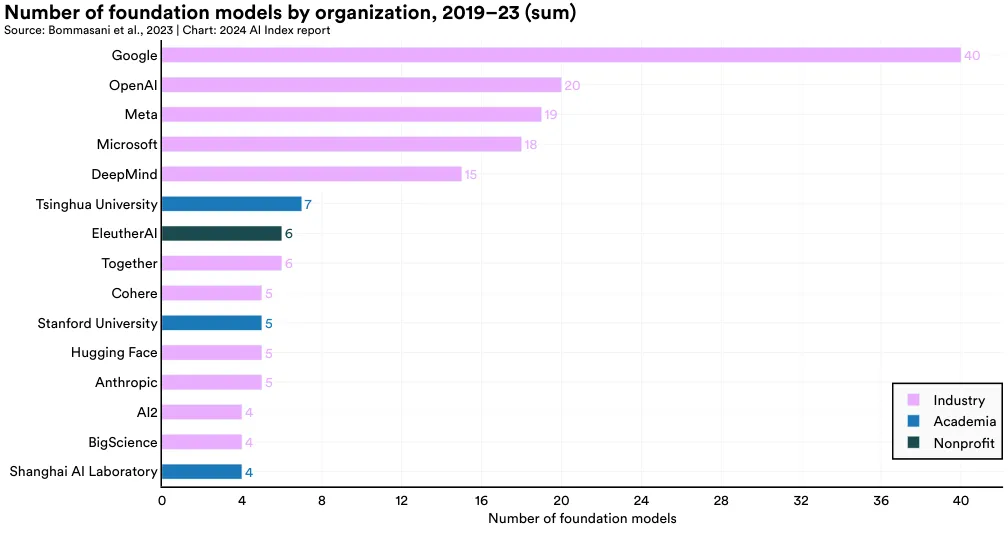
Since 2019, Google has led in releasing the most foundation models, with a total of 40, followed by OpenAI with 20 (Figure 1.3.17). Tsinghua University stands out as the top non-Western institution, with seven foundation model releases, while Stanford University is the leading American academic institution, with five releases.
National Affiliation
Given that foundation models are fairly representative of frontier AI research, from a geopolitical perspective, it is important to understand their national affiliations. Figures 1.3.18, 1.3.19, and 1.3.20 visualize the national affiliations of various foundation models. As with the notable model analysis presented earlier in the chapter, a model is deemed affiliated with a country if a researcher contributing to that model is affiliated with an institution headquartered in that country.
In 2023, most of the world's foundation models originated from the United States (109), followed by China (20), and the United Kingdom (Figure 1.3.18). Since 2019, the United States has consistently led in originating the majority of foundation models (Figure 1.3.19).
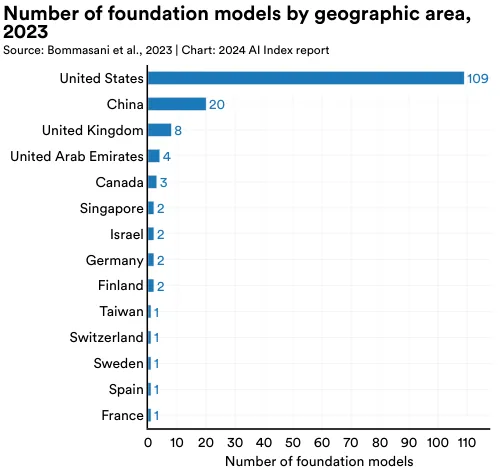
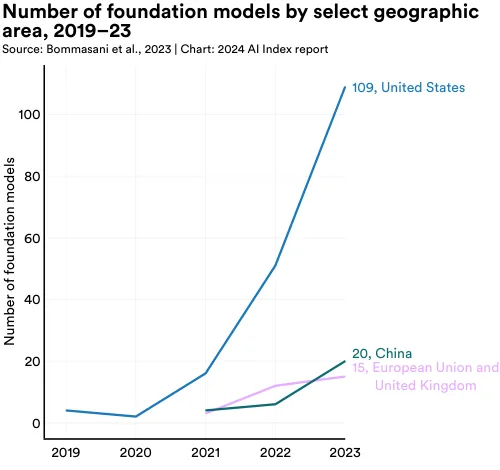
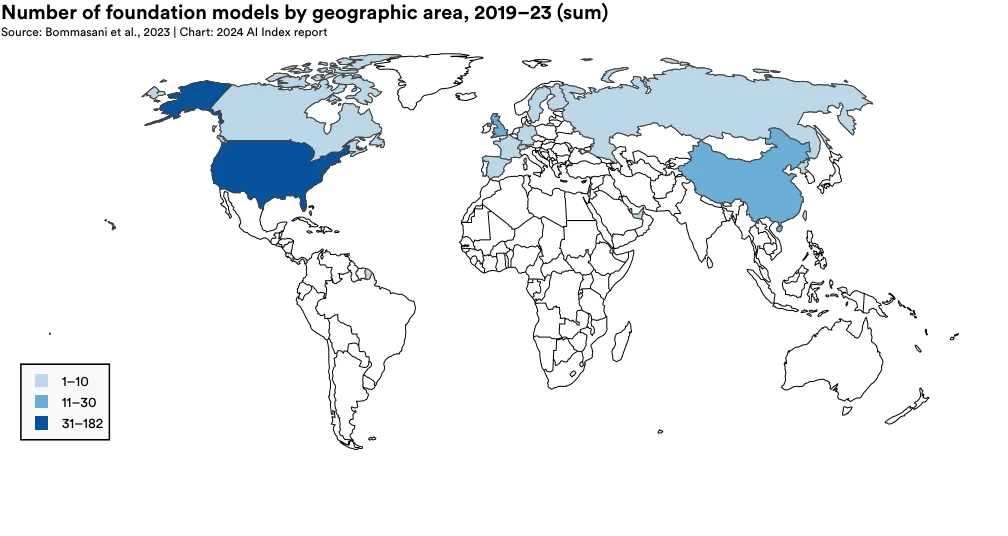
Figure 1.3.20 depicts the cumulative count of foundation models released and attributed to respective countries since 2019. The country with the greatest number of foundation models released since 2019 is the United States (182), followed by China (30), and the United Kingdom (21).
Training Cost
A prominent topic in discussions about foundation models is their speculated costs. While AI companies seldom reveal the expenses involved in training their models, it is widely believed that these costs run into millions of dollars and are rising. For instance, OpenAI's CEO, Sam Altman, mentioned that the training cost for GPT-4 was over $100 million. This escalation in training expenses has effectively excluded universities, traditionally centers of AI research, from developing their own leading-edge foundation models. In response, policy initiatives, such as President Biden's Executive Order on AI, have sought to level the playing field between industry and academia by creating a National AI Research Resource, which would grant nonindustry actors the compute and data needed to do higher level AI-research.
Understanding the cost of training AI models is important, yet detailed information on these costs remains scarce. The AI Index was among the first to offer estimates on the training costs of foundation models in last year's publication. This year, the AI Index has collaborated with Epoch AI, an AI research institute, to substantially enhance and solidify the robustness of its AI training cost estimates.9 To estimate the cost of cutting-edge models, the Epoch team analyzed training duration, as well as the type, quantity, and utilization rate of the training hardware, using information from publications, press releases, or technical reports related to the models.10
Figure 1.3.21 visualizes the estimated training cost associated with select AI models, based on cloud compute rental prices. AI Index estimates validate suspicions that in recent years model training costs have significantly increased. For example, in 2017, the original Transformer model, which introduced the architecture that underpins virtually every modern LLM, cost around 160,000 to train. Fast-forward to 2023, and training costs for OpenAI's GPT-4 and Google's Gemini Ultra are estimated to be around 191 million, respectively.
9 Ben Cottier and Robi Rahman led research at Epoch AI into model training cost. 10 A detailed description of the estimation methodology is provided in the Appendix. 11 The cost figures reported in this section are inflation-adjusted.
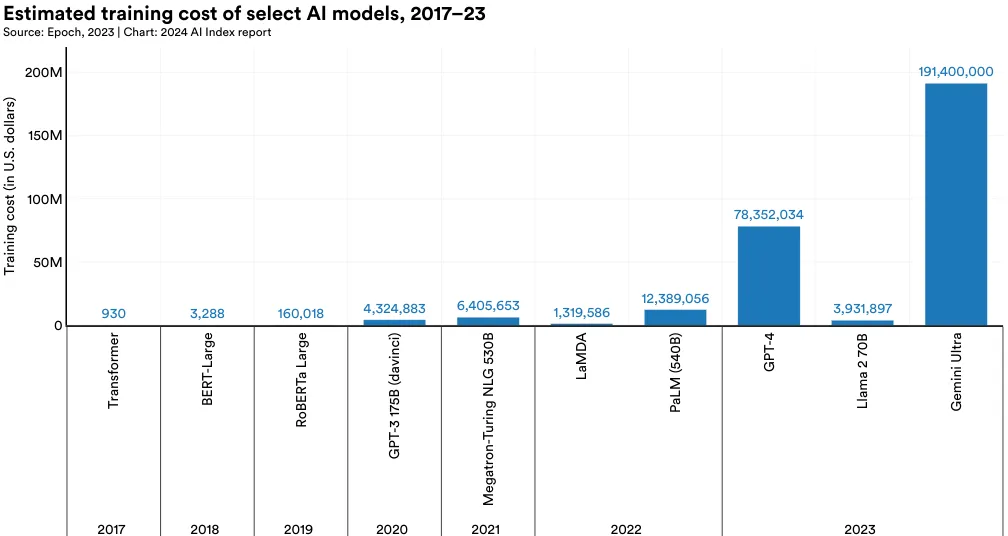
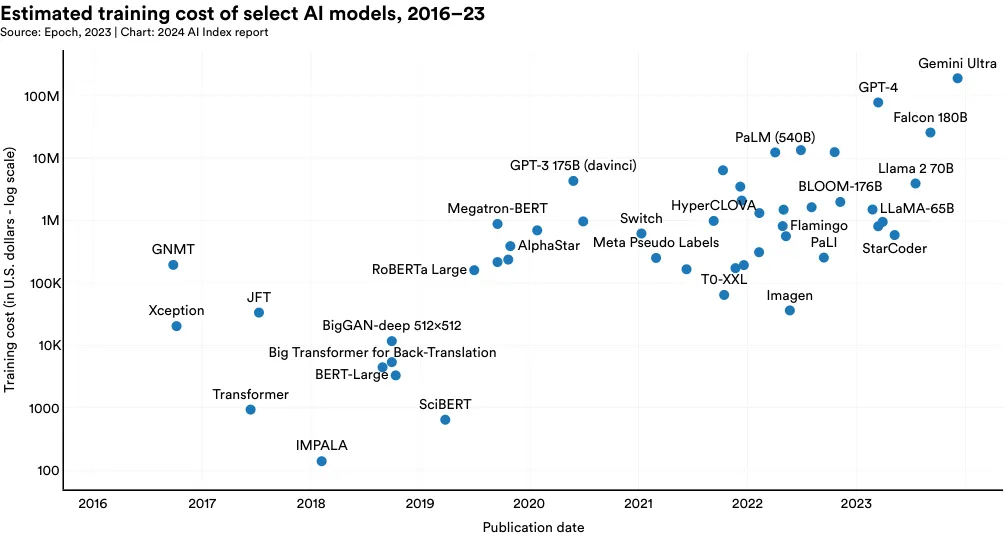
Figure 1.3.22 visualizes the training cost of all AI models for which the AI Index has estimates. As the figure shows, model training costs have sharply increased over time.
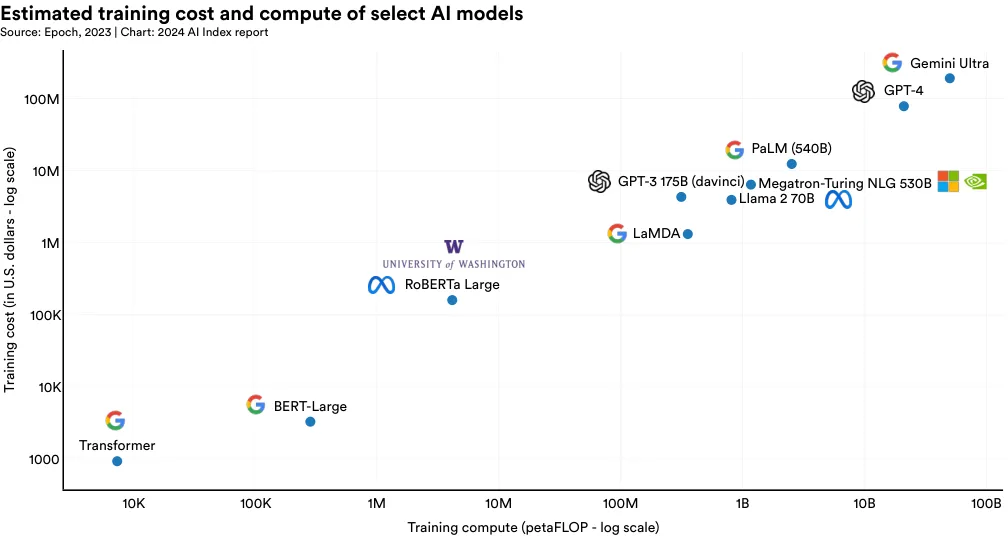
As established in previous AI Index reports, there is a direct correlation between the training costs of AI models and their computational requirements. As illustrated in Figure 1.3.23, models with greater computational training needs cost substantially more to train.
AI conferences serve as essential platforms for researchers to present their findings and network with peers and collaborators. Over the past two decades, these conferences have expanded in scale, quantity, and prestige.
1.4 Ai Conferences Conference Attendance
Conference Attendance
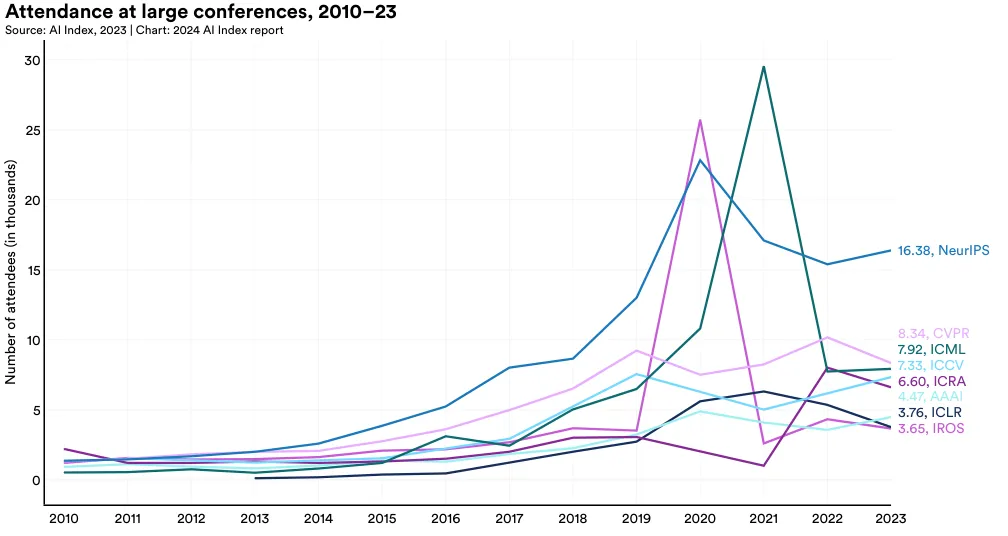
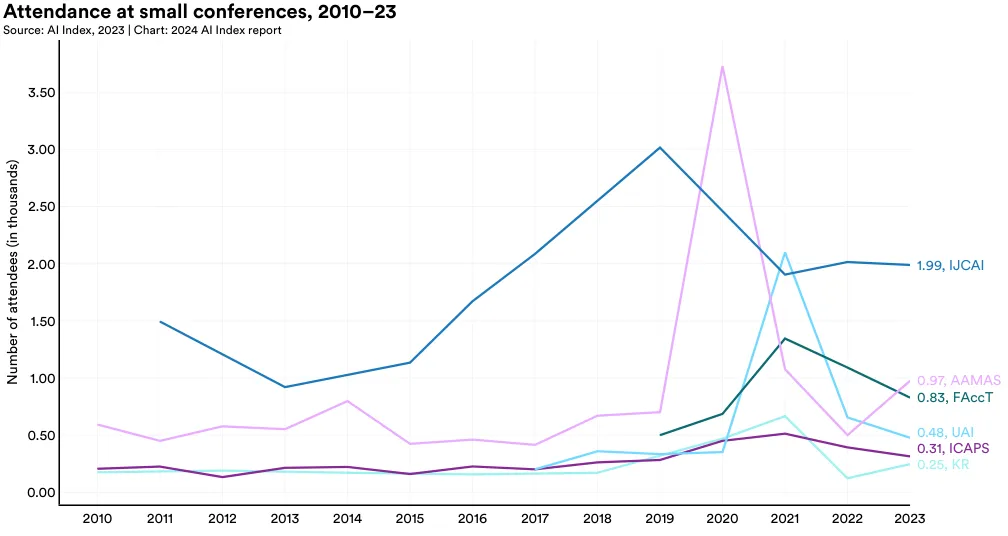
Figure 1.4.1 graphs attendance at a selection of AI conferences since 2010. Following a decline in attendance, likely due to the shift back to exclusively in-person formats, the AI Index reports an increase in conference attendance from 2022 to 2023.12
Specifically, there was a 6.7% rise in total attendance over the last year. Since 2015, the annual number of attendees has risen by around 50,000, reflecting not just a growing interest in AI research but also the emergence of new AI conferences.
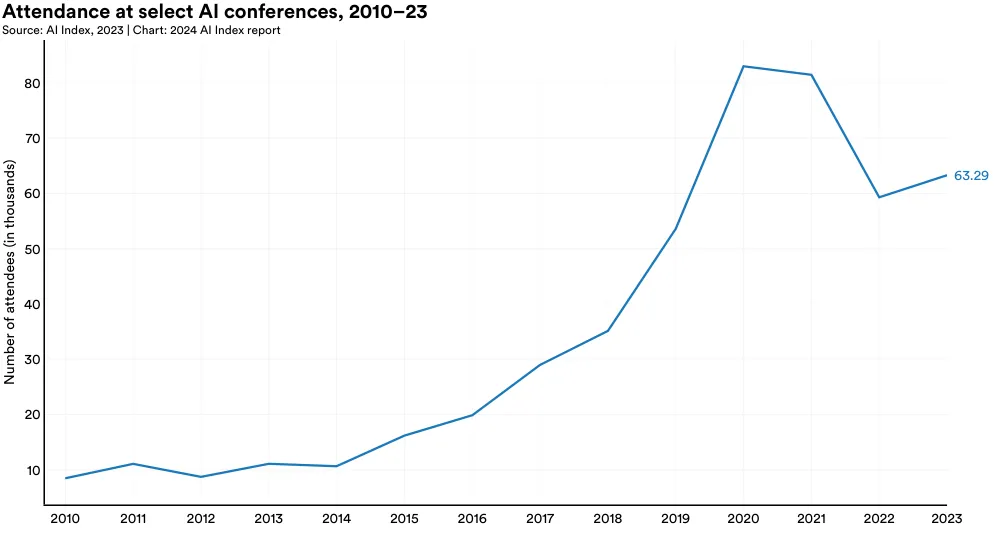
12 This data should be interpreted with caution given that many conferences in the last few years have had virtual or hybrid formats. Conference organizers report that measuring the exact attendance numbers at virtual conferences is difficult, as virtual conferences allow for higher attendance of researchers from around the world. The conferences for which the AI Index tracked data include NeurIPS, CVPR, ICML, ICCV, ICRA, AAAI, ICLR, IROS, IJCAI, AAMAS, FAccT, UAI, ICAPS, and KR.
Neural Information Processing Systems (NeurIPS) remains one of the most attended AI conferences, attracting approximately 16,380 participants in 2023 (Figure 1.4.2 and Figure 1.4.3). Among the major AI conferences, NeurIPS, ICML, ICCV, and AAAI experienced year-over-year increases in attendance. However, in the past year, CVPR, ICRA, ICLR, and IROS observed slight declines in their attendance figures.
GitHub is a web-based platform that enables individuals and teams to host, review, and collaborate on code repositories. Widely used by software developers, GitHub facilitates code management, project collaboration, and open-source software support. This section draws on data from GitHub providing insights into broader trends in open-source AI software development not reflected in academic publication data.
1.5 Open-Source Ai Software
Projects
A GitHub project comprises a collection of files, including source code, documentation, configuration files, and images, that together make up a software project. Figure 1.5.1 looks at the total number of GitHub AI projects over time. Since 2011, the number of AI-related GitHub projects has seen a consistent increase, growing from 845 in 2011 to approximately 1.8 million in 2023.13 Notably, there was a sharp 59.3% rise in the total number of GitHub AI projects in the last year alone.
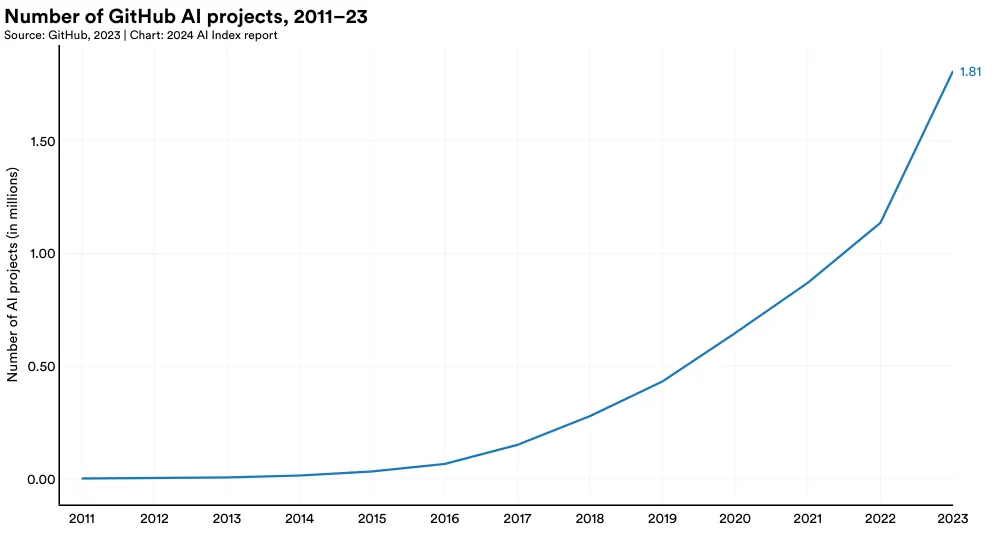
13 GitHub’s methodology for identifying AI-related projects has evolved over the past year. For classifying AI projects, GitHub has started incorporating generative AI keywords from a recently published research paper, a shift from the previously detailed methodology in an earlier paper. This edition of the AI Index is the first to adopt this updated approach. Moreover, the previous edition of the AI Index utilized country-level mapping of GitHub AI projects conducted by the OECD, which depended on self-reported data—a method experiencing a decline in coverage over time. This year, the AI Index has adopted geographic mapping from GitHub, leveraging server-side data for broader coverage. Consequently, the data presented here may not align perfectly with data in earlier versions of the report.
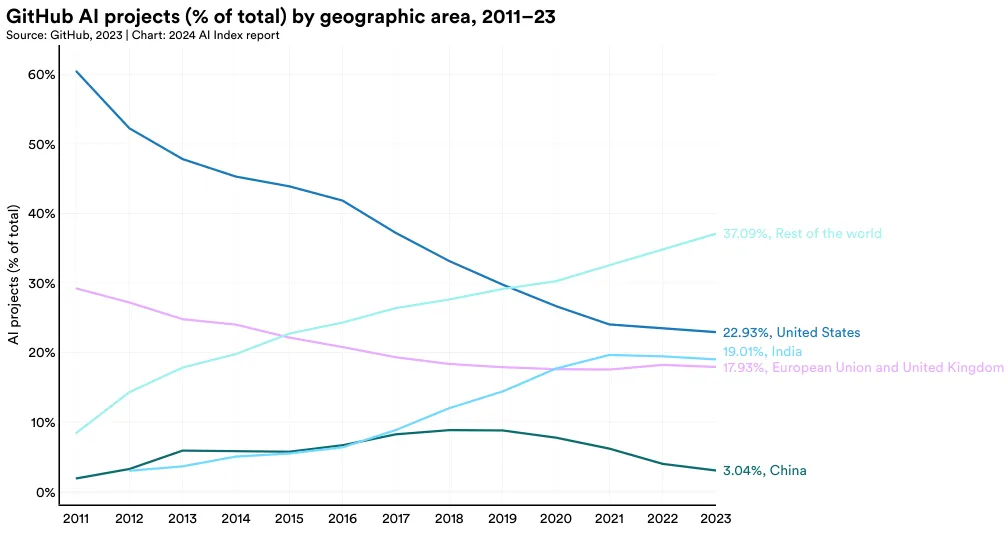
Figure 1.5.2 reports GitHub AI projects by geographic area since 2011. As of 2023, a significant share of GitHub AI projects were located in the United States, accounting for 22.9% of contributions. India was the second-largest contributor with 19.0%, followed closely by the European Union and the United Kingdom at 17.9%. Notably, the proportion of AI projects from developers located in the United States on GitHub has been on a steady decline since 2016.
Stars
GitHub users can show their interest in a repository by “starring” it, a feature similar to liking a post on social media, which signifies support for an open- source project. Among the most starred repositories are libraries such as TensorFlow, OpenCV, Keras, and PyTorch, which enjoy widespread popularity among software developers in the AI coding community. For example, TensorFlow is a popular library for building and deploying machine learning models. OpenCV is a platform that offers a variety of tools for computer vision, such as object detection and feature extraction.
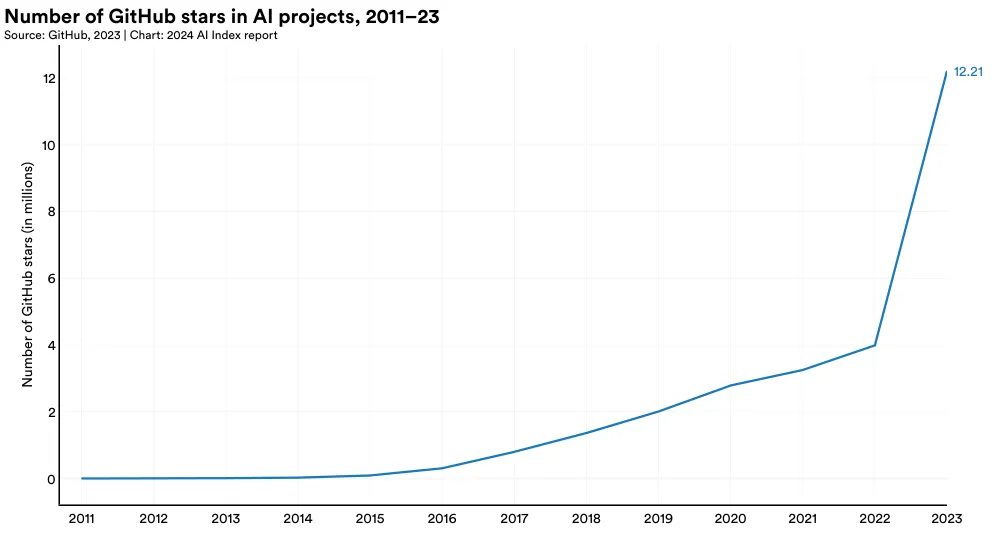
The total number of stars for AI-related projects on GitHub saw a significant increase in the last year, more than tripling from 4.0 million in 2022 to 12.2 million in 2023 (Figure 1.5.3). This sharp increase in GitHub stars, along with the previously reported rise in projects, underscores the accelerating growth of open-source AI software development.
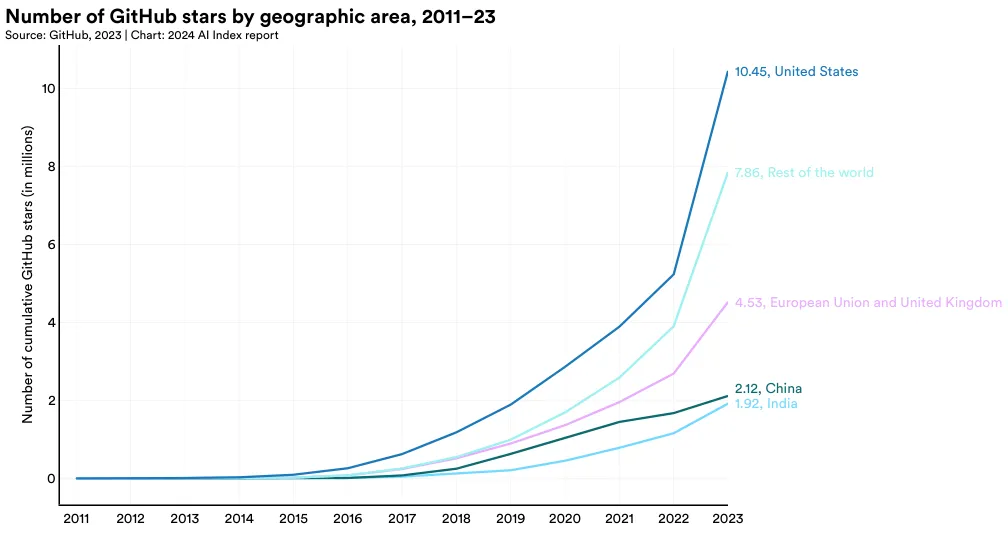
In 2023, the United States led in receiving the highest number of GitHub stars, totaling 10.5 million (Figure 1.5.4). All major geographic regions sampled, including the European Union and United Kingdom, China, and India, saw a year-over-year increase in the total number of GitHub stars awarded to projects located in their countries.
Appendix
Acknowledgments
The AI Index would like to acknowledge Ben Cottier and Robi Rahman from Epoch for leading the work analyzing machine learning training costs; Robi Rahman for leading work regarding the national affiliation of notable systems; and James da Costa, for doing coding work instrumental to the sectoral and national affiliation analysis of foundation models.
AI Conference Attendance
The AI Index reached out to the organizers of various AI conferences in 2023 and asked them to provide information on total attendance. Some conferences posted their attendance totals online; when this was the case, the AI Index used those reported totals and did not reach out to the conference organizers.
CSET
Prepared by Autumn Toney
The Center for Security and Emerging Technology (CSET) is a policy research organization within Georgetown University’s Walsh School of Foreign Service that produces data-driven research at the intersection of security and technology, providing nonpartisan analysis to the policy community.
For more information about how CSET analyzes bibliometric and patent data, see the Country Activity Tracker (CAT) documentation on the Emerging Technology Observatory’s website.1 Using CAT, users can also interact with country bibliometric, patent, and investment data.2
Publications From CSET Merged Corpus of Scholarly Literature
Sources
CSET’s merged corpus of scholarly literature combines distinct publications from Clarivate’s Web of Science, OpenAlex, The Lens, Semantic Scholar, arXiv, and Papers With Code.
Updates: The source list of scholarly literature for CSET’s merged corpus has been changed from prior years, with the inclusion of OpenAlex, the Lens, and Semantic Scholar, and the exclusion of Digital Science’s Dimensions and the Chinese National Knowledge Infrastructure (CNKI).
Methodology
To create the merged corpus, CSET deduplicated across the listed sources using publication metadata, and then combined the metadata for linked publications. For analysis of AI publications, CSET used an English-language subset of this corpus published since 2010. CSET researchers developed a classifier for identifying AI-related publications by leveraging the arXiv repository, where authors and editors tag papers by subject.3
Updates: The AI classifier was updated from the version used in prior years; Dunham, Melot, and Murdick4 describe the previously implemented classifier; and Schoeberl, Toney, and Dunham describe the updated classifier used in this analysis.
CSET matched each publication in the analytic corpus with predictions from a field-of-study model derived from Microsoft Academic Graph (MAG)’s taxonomy, which yields hierarchical labels describing the published research field(s) of study and corresponding scores.5 CSET researchers identified the most common fields of study in our corpus of AI-relevant publications since 2010 and recorded publications in all other fields as “Other AI.” English-language AI-relevant publications were then tallied by their top-scoring field and publication year. Updates: The methodology to assign MAG fields of study was updated from the methodology used in prior years. Toney and Dunham describe the field of study assignment pipeline used in this analysis; prior years used the original MAG implementation.
CSET also provided publication counts and year-by- year citations for AI-relevant work associated with each country. A publication is associated with a country if it has at least one author whose organizational affiliation(s) is located in that country. If there is no observed country, the publication receives an “Unknown/Missing” country label. Citation counts aren’t available for all publications; those without counts weren’t included in the citation analysis. Over 70% of English-language AI papers published between 2010 and 2022 have citation data available.
Additionally, publication counts by year and by publication type (e.g., academic journal articles, conference papers) were provided where available. These publication types were disaggregated by affiliation country as described above.
CSET also provided publication affiliation sector(s) where, as in the country attribution analysis, sectors were associated with publications through authors’ affiliations. Not all affiliations were characterized in terms of sectors; CSET researchers relied primarily on ROR for this purpose, and not all organizations can be found in or linked to ROR.6 Where the affiliation sector is available, papers were counted toward these sectors, by year.
CSET counted cross-sector collaborations as distinct pairs of sectors across authors for each publication. Collaborations are only counted once: For example, if a publication has two authors with an academic affiliation and two with an industry affiliation, it is counted as a single academic-industry collaboration.
Patents From CSET’s AI and Robotics Patents Dataset Source
CSET’s AI patents dataset was developed by CSET and 1790 Analytics and includes data from The Lens, 1790 Analytics, and EPO’s PATSTAT. Patents relevant to the development and application of AI and robotics were identified by their CPC/IPC codes and keywords.
Methodology
In this analysis, patents were grouped by year and country, and then counted at the “patent family” classifier; and Schoeberl, Toney, and Dunham describe the updated classifier used in this analysis.
CSET matched each publication in the analytic corpus with predictions from a field-of-study model derived from Microsoft Academic Graph (MAG)’s taxonomy, which yields hierarchical labels describing the published research field(s) of study and corresponding scores.5 CSET researchers identified the most common fields of study in our corpus of AI-relevant publications since 2010 and recorded publications in all other fields as “Other AI.” English-language AI-relevant publications were then tallied by their top-scoring field and publication year.
Updates: The methodology to assign MAG fields of study was updated from the methodology used in prior years. Toney and Dunham describe the field of study assignment pipeline used in this analysis; prior years used the original MAG implementation.
CSET also provided publication counts and year-by- year citations for AI-relevant work associated with each country. A publication is associated with a country if it has at least one author whose organizational affiliation(s) is located in that country. If there is no observed country, the publication receives an “Unknown/Missing” country label. Citation counts aren’t available for all publications; those without counts weren’t included in the citation analysis. Over 70% of English-language AI papers published between 2010 and 2022 have citation data available.
Additionally, publication counts by year and by publication type (e.g., academic journal articles, conference papers) were provided where available. These publication types were disaggregated by affiliation country as described above.
CSET also provided publication affiliation sector(s) where, as in the country attribution analysis, sectors were associated with publications through authors’ affiliations. Not all affiliations were characterized in terms of sectors; CSET researchers relied primarily on ROR for this purpose, and not all organizations can be found in or linked to ROR.6 Where the affiliation sector is available, papers were counted toward these sectors, by year.
CSET counted cross-sector collaborations as distinct pairs of sectors across authors for each publication. Collaborations are only counted once: For example, if a publication has two authors with an academic affiliation and two with an industry affiliation, it is counted as a single academic-industry collaboration.
Patents From CSET’s AI and Robotics Patents Dataset
Source
CSET’s AI patents dataset was developed by CSET and 1790 Analytics and includes data from The Lens, 1790 Analytics, and EPO’s PATSTAT. Patents relevant to the development and application of AI and robotics were identified by their CPC/IPC codes and keywords.
Methodology
In this analysis, patents were grouped by year and country, and then counted at the “patent family” level.7 CSET extracted year values from the first publication date within a family. Countries are assigned to patents based on the country or filing office where a patent is first filed (e.g., if a patent is filed with the USPTO on January 1, 2020, and then with the German Patenting Office on January 2, 2020, the patent is classified as a patent with U.S. inventors).8 Note that the same patent may have multiple countries (but not years) attributed to it if the inventors filed their patent in multiple countries on the same first filing date (e.g., if a patent is filed with the USPTO on January 1, 2020, and then with the German Patenting Office on January 1, 2020, the patent is classified as a patent with U.S. inventors and as a patent with German inventors).
Note that patents filed with supranational organizations, such as patents filed under WIPO (the World Intellectual Property Organization), EP (European Patent Organization), and EA (a special area of Spain not included in the European Union), also fall under the “Rest of World” category.
Ecosystems Graph Analysis
To track the distribution of AI foundation models by country, the AI Index team took the following steps:
- A snapshot of the Ecosystems Graph was taken in early January 2024.
- Authors of foundation models are attributed to countries based on their affiliation credited on the paper/technical documentation associated with the model. For international organizations, authors are attributed to the country where the organization is headquartered, unless a more specific location is indicated.
- All of the landmark publications are aggregated within time periods (e.g., monthly or yearly) with the national contributions added up to determine what each country’s contribution to landmark AI research was during each time period.
- The contributions of different countries are compared over time to identify any trends.
Epoch Notable Models Analysis
The AI forecasting research group Epoch maintains a dataset of landmark AI and ML models, along with accompanying information about their creators and publications, such as the list of their (co)authors, number of citations, type of AI task accomplished, and amount of compute used in training.
The nationalities of the authors of these papers have important implications for geopolitical AI forecasting. As various research institutions and technology companies start producing advanced ML models, the global distribution of future AI development may shift or concentrate in certain places, which in turn affects the geopolitical landscape because AI is expected to become a crucial component of economic and military power in the near future.
To track the distribution of AI research contributions on landmark publications by country, the Epoch dataset is coded according to the following methodology:
-
A snapshot of the dataset was taken on January 1, 2024. This includes papers about landmark models, selected using the inclusion criteria of importance, relevance, and uniqueness, as described in the Compute Trends dataset documentation.
-
The authors are attributed to countries based on their affiliation credited on the paper. For international organizations, authors are attributed to the country where the organization is headquartered, unless a more specific location is indicated.
-
All of the landmark publications are aggregated within time periods (e.g., monthly or yearly) with the national contributions added up to determine what each country’s contribution to landmark AI research was during each time period.
-
The contributions of different countries are compared over time to identify any trends.
GitHub
Identifying AI Projects
In partnership with researchers from Harvard Business School, Microsoft Research, and Microsoft’s AI for Good Lab, GitHub identifies public AI repositories following the methodologies of Gonzalez, Zimmerman, and Nagappan, 2020, and Dohmke, Iansiti, and Richards, 2023, using topic labels related to AI/ML and generative AI, respectively, along with the topics “machine learning,” “deep learning,” or “artificial intelligence.” GitHub further augments the dataset with repositories that have a dependency on the PyTorch, TensorFlow, or OpenAI libraries for Python.
Mapping AI Projects to Geographic Areas
Public AI projects are mapped to geographic areas using IP address geolocation to determine the mode location of a project’s owners each year. Each project owner is assigned a location based on their IP address when interacting with GitHub. If a project owner changes locations within a year, the location for the project would be determined by the mode location of its owners sampled daily in the year. Additionally, the last known location of the project owner is carried forward on a daily basis even if no activities were performed by the project owner that day. For example, if a project owner performed activities within the United States and then became inactive for six days, that project owner would be considered to be in the United States for that seven-day span.
Training Cost Analysis
To create the dataset of cost estimates, the Epoch database was filtered for models released during the large-scale ML era9 that were above the median of training compute in a two-year window centered on their release date. This filtered for the largest-scale ML models. There were 138 qualifying systems based on these criteria. Of these systems, 48 had sufficient information to estimate the training cost.
For the selected ML models, the training time and the type, quantity, and utilization rate of the training hardware were determined from the publication, press release, or technical reports, as applicable. Cloud rental prices for the computing hardware used by these models were collected from online historical archives of cloud vendors’ websites.10
Training costs were estimated from the hardware type, quantity, and time by multiplying the hourly cloud rental cost rates (at the time of training)11 by the quantity of hardware hours. This yielded the cost to train each model using the same hardware used by the authors to train the same model at the time. However, some developers purchased hardware rather than renting cloud computers, so the true costs incurred by the developers may vary.
Various challenges were encountered while estimating the training cost of these models. Often, the developers did not disclose the duration of training or the hardware that was used. In other cases, cloud compute pricing was not available for the hardware. The investigation of training cost trends is continued in a forthcoming Epoch report, including an expanded dataset with more models and hardware prices.
1 https://eto.tech/tool-docs/cat/\ 2 https://cat.eto.tech/\ 3 Christian Schoeberl, Autumn Toney, and James Dunham, “Identifying AI Research” (Center for Security and Emerging Technology, July 2023), https://doi.org/10.51593/20220030.\ 4 James Dunham, Jennifer Melot, and Dewey Murdick, “Identifying the Development and Application of Artificial Intelligence in Scientific Text,” arXiv preprint, arXiv:2002.07143 (2020).
5 These scores are based on cosine similarities between field-of-study and paper embeddings. See Autumn Toney and James Dunham, “Multi-Label Classification of Scientific Research Documents Across Domains and Languages,” Proceedings of the Third Workshop on Scholarly Document Processing (Association for Computational Linguistics, 2022): 105–14, https:// aclanthology.org/2022.sdp-1.12/.
6 See https://ror.org/ for more information about the ROR dataset.
7 Patents are analyzed at the “patent family” level rather than “patent document” level because patent families are a collective of patent documents all associated with a single invention and/ or innovation by the same inventors/assignees. Thus, counting at the “patent family” level mitigates artificial number inflation when there are multiple patent documents in a patent family or if a patent is filed in multiple jurisdictions.
8 In CSET’s data analysis for the 2022 AI Index, we used the most recent publication date for a patent family. This method has the advantage of capturing updates within a patent family (such as amendments). However, to remain consistent with CSET’s other data products, including the Country Activity Tracker (available at https://cat.eto.tech/), we opted to use the first filing year instead in this data analysis.
9 The selected cutoff date was September 1, 2015, in accordance with Compute Trends Across Three Eras of Machine Learning (Epoch, 2022).
10 Historic prices were collected from archived snapshots of Amazon Web Services, Microsoft Azure, and Google Cloud Platform price catalogs viewed through the Internet Archive Wayback Machine.
11 The chosen rental cost rate was the most recent published price for the hardware and cloud vendor used by the developer of the model, at a three-year commitment rental rate, after subtracting the training duration and two months from the publication date. If this price was not available, the most analogous price was used: the same hardware and vendor at a different date, otherwise the same hardware from a different cloud vendor. If a three-year commitment rental rate was unavailable, this was imputed from other rental rates based on the empirical average discount for the given cloud vendor. If the exact hardware type was not available, e.g., “NVIDIA A100 SXM4 40GB,” then a generalization was used, e.g., “NVIDIA A100.”